Museums in the Digital Age: Designing Collections Through Computational Workflows
Most collections-based museums safeguard and exhibit a wide variety of objects, art, and artifacts. These institutions often face a common challenge: how to store and manage vast, diverse collections within facilities which may not have been designed for their evolving needs. When the time comes to planning a new, expanded, or renovated facility, the complexity multiplies—not only for the design team but also for the collections staff who must ensure that every object is properly housed and accessible.
The Challenge of Collections Planning
Collections planning projects are inherently complex because of the sheer number of variables involved: media type, quantity, storage format, environmental requirements, access needs, and spatial requirements. Traditionally, volumetric assessments for collections have been executed in Excel, using formulas to estimate space requirements. While this method works for basic calculations, it falls short in helping teams visualize what those numbers mean in physical spaces. Adjusting shelving dimensions or layouts in response to spatial constraints becomes a tedious, manual process.
This lack of visualization often leads to a suboptimal design approach—one that is labor-intensive, time-consuming, and prone to miscommunication. For institutions managing hundreds of thousands of objects, this inefficiency can translate into significant delays and costs.
Bridging the Gap with Computational Tools
Recognizing these challenges, SmithGroup explored how parametric software could bridge the gap between raw data and spatial design. These tools allow designers to manage large quantities of data, handle multiple independent variables, and create real-time 3D models that respond dynamically to current and projected collection revisions.
The result is a computational workflow that transforms static spreadsheets into smart interactive, visual planning tools.
Key Goals of the Workflow
- Enable flexible, real-time 3D visualization and planning of current and projected storage capabilities in architectural spaces.
- Easily right-size rooms to account for realistic square footage storage needs.
- Streamline collaboration with shelving vendors for layouts and cost estimating.
- Provide museum clients with intuitive graphics and dashboards for understanding volumetric needs without requiring specialized modeling software.
A Real-World Example
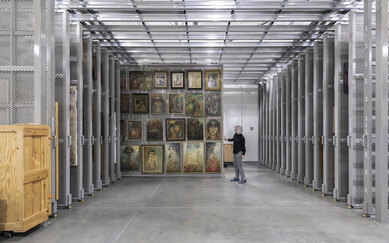
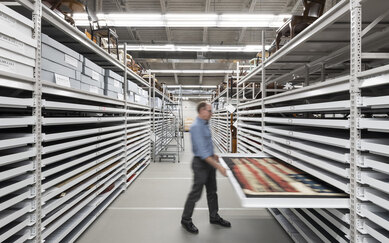
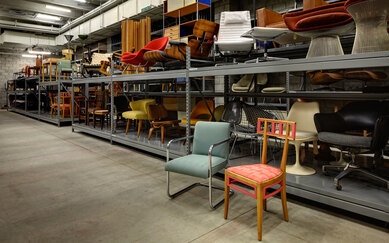
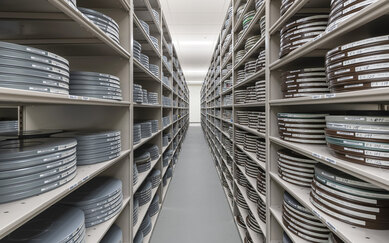
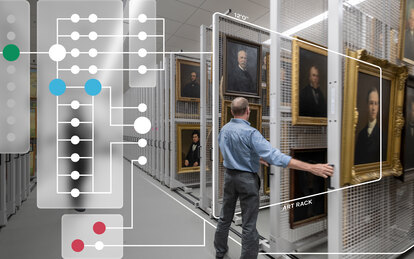
One recent project involved rehousing six million artifacts and objects from three separate buildings into a single large warehouse for a world-class institution. The collection included everything from large historical objects and fine art to manuscripts, photographs, films, archaeological finds, and zoological specimens. Each category had unique environmental and adjacency requirements, making planning a monumental task. The workflow outlined below allowed the design team to understand how the comprehensive collection could fit in a new space, how rooms could be divided and right sized, and how much collections growth or reorganization could be afforded.
The Technical Workflow
1 | Data Collection and Organization
The major challenge in any collections planning and design process is data collection. Every institution manages and catalogues their collection in unique ways. How items are sized, counted, described, and named in an institution’s collections management software is rarely reliable enough as a starting point for volumetric data without some degree of validation. This can be further complicated by collections that are stored too densely or in an improper format – a common challenge for institutions that are embarking on a collections storage project. So, we start our work in a familiar format – an Excel spreadsheet – to provide curators and collections managers a venue to validate existing collection data. Reliable shelving dimensional data for collections is recorded and organized, gaps in data requiring manual validation are identified, and adjustments for collections that may need to be re-housed or infused with a little more breathing room (decompression) are recorded. Gradually, a reliable comprehensive database is developed with quantities and dimensions, proposed environmental criteria, anticipated growth factors, required adjacencies or compartmentalization requirements, and proposed storage format (e.g., shelving, cabinets, art racks).
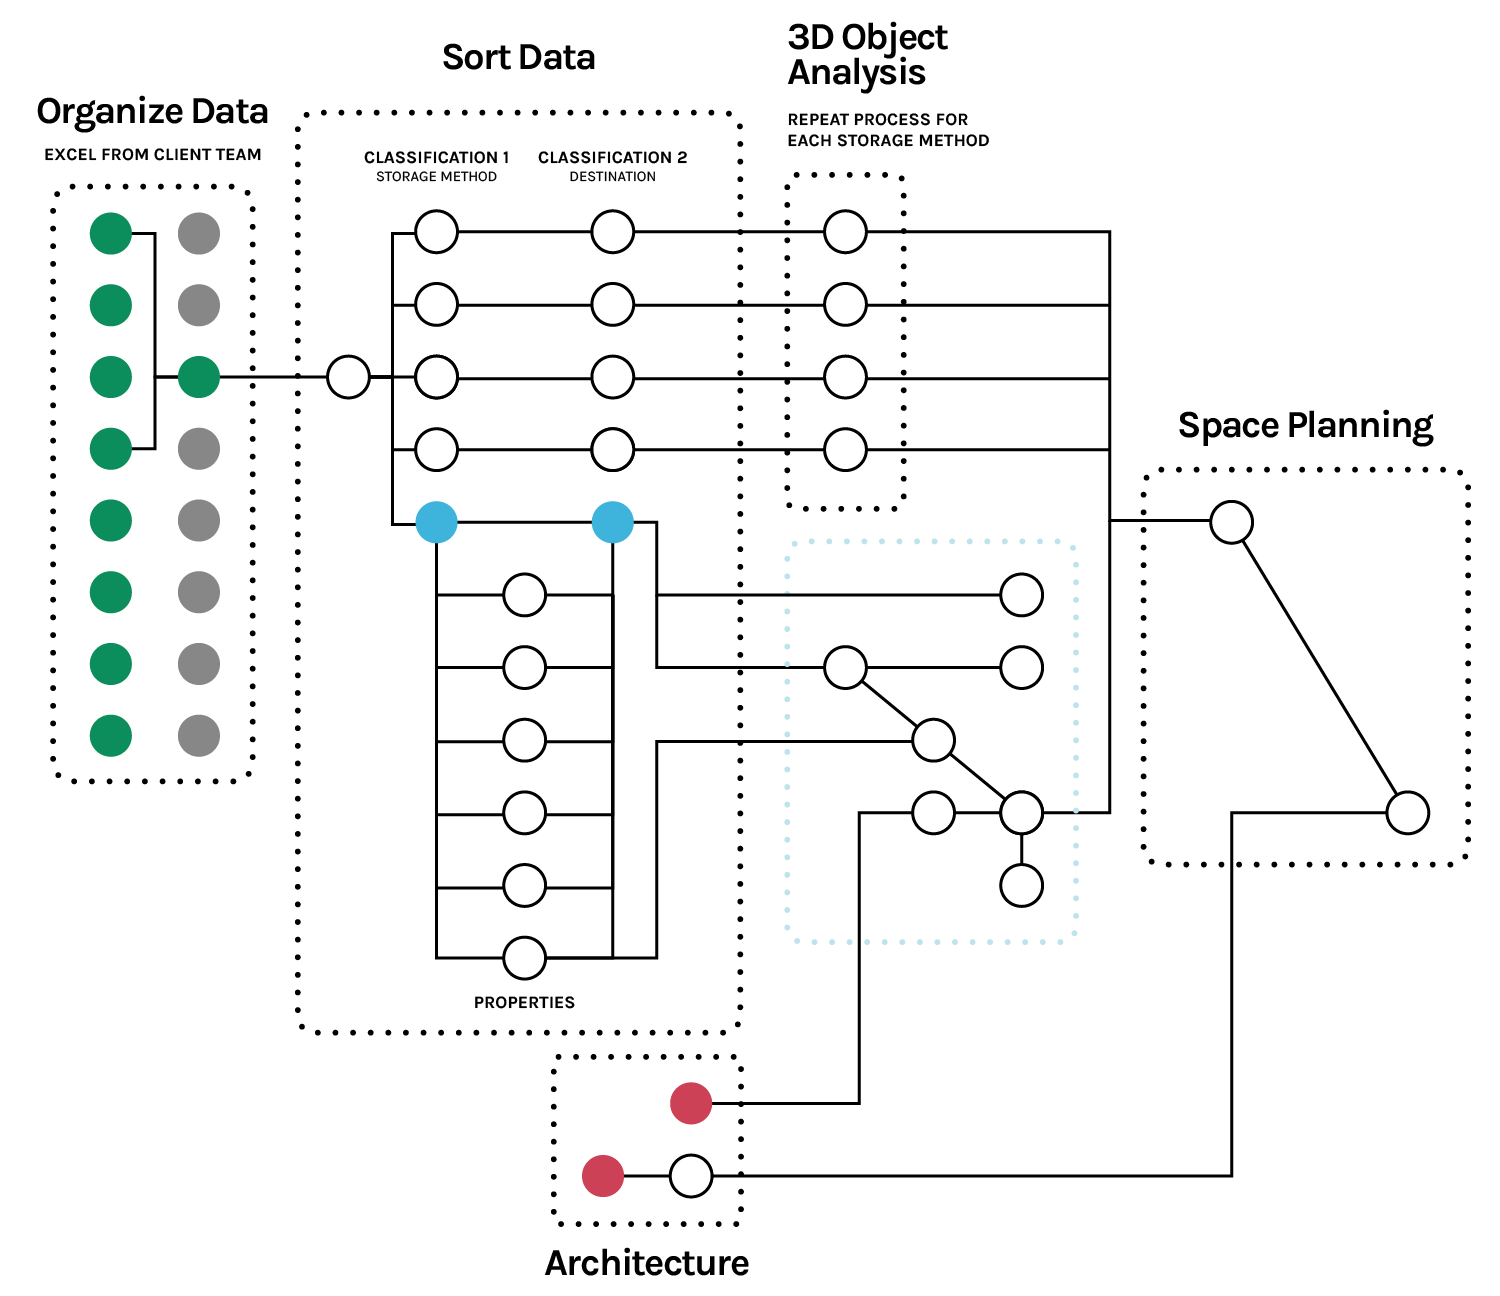
2 | Parametric Modeling with Grasshopper
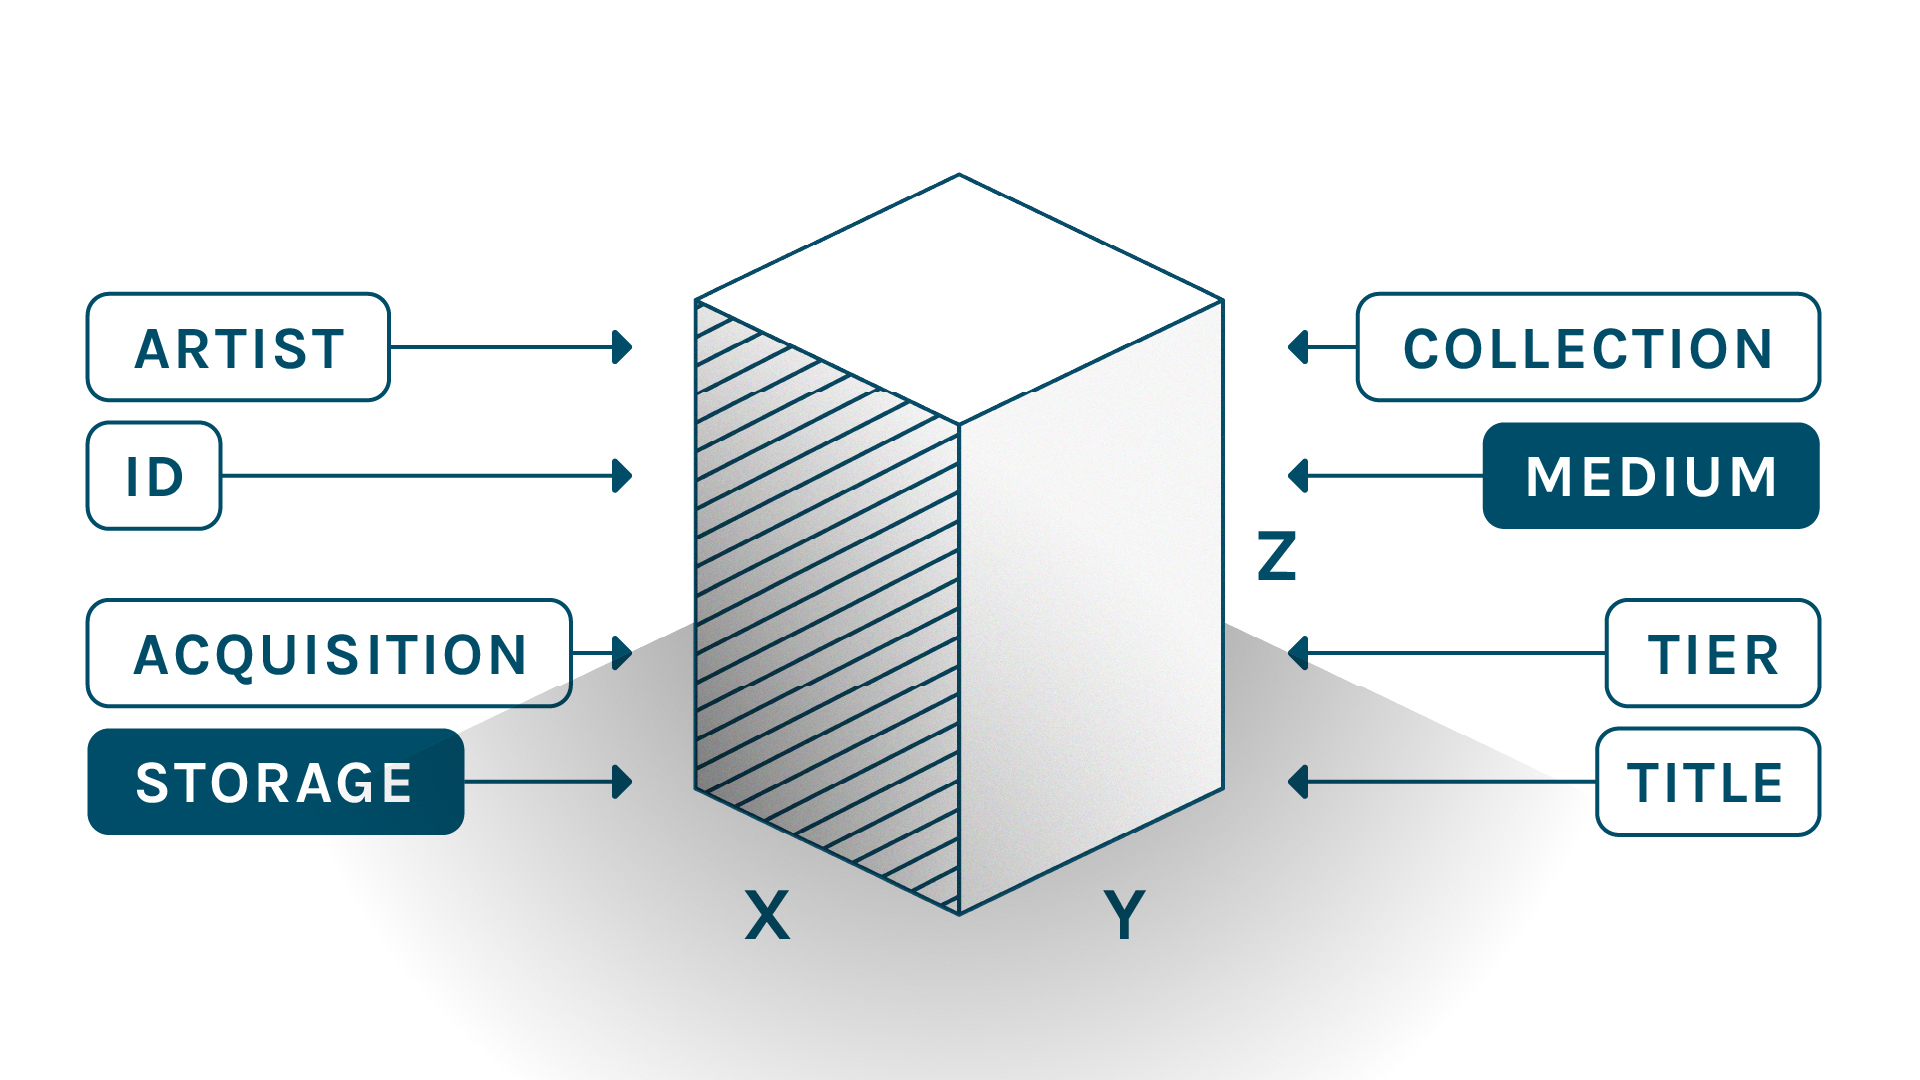
Using Grasshopper, a visual-scripting interface, we import the Excel data. The script sorts items first by the discrete area requirements and their corresponding environmental criteria (e.g. Fine Art, Archeology, Photography), then by storage format and if necessary, by department or sub-collection.
Each line item is visualized as a grouped array of properly scaled 3D elements, allowing teams to understand relative collection size and distribution. It is also a helpful tool to visually identify anomalies that may point to database errors which can be easily corrected. The process is analogous to virtually laying out all the library books on the floor before organizing them into shelves. This immediate high-level feedback accelerates decision-making and reduces guesswork.
Next, the script calculates the volumes, applies a decompression factor, and aggregates the total required volumetric need. The logic includes a future growth variable for quick adjustments.
Shelving units—defined by width, depth, height, aisle spacing, and rotation—are entirely parametric. As there are many different types of storage formats, each respective type has different dimensional properties. So, as volumetric demand is adjusted through discussions with the client team about growth or right-sizing decompression, the script automatically redistributes the need across the shelving geometry and adjusts the occupied square footage.
3 | Integration with Architectural Design and Visualization
A Rhino-Inside-Revit script enables near-instant import of these 3D shelving models into Revit, ensuring that architectural planning and schematic documentation efforts align with collections requirements. Since the workflow is automated, any updates to the Excel data cascade through the entire system. The parametric design tool is also connected to a custom interactive dashboard that gives internal teams and museum leadership a clear, visual understanding of volumetric needs—without requiring them to open complex modeling software.
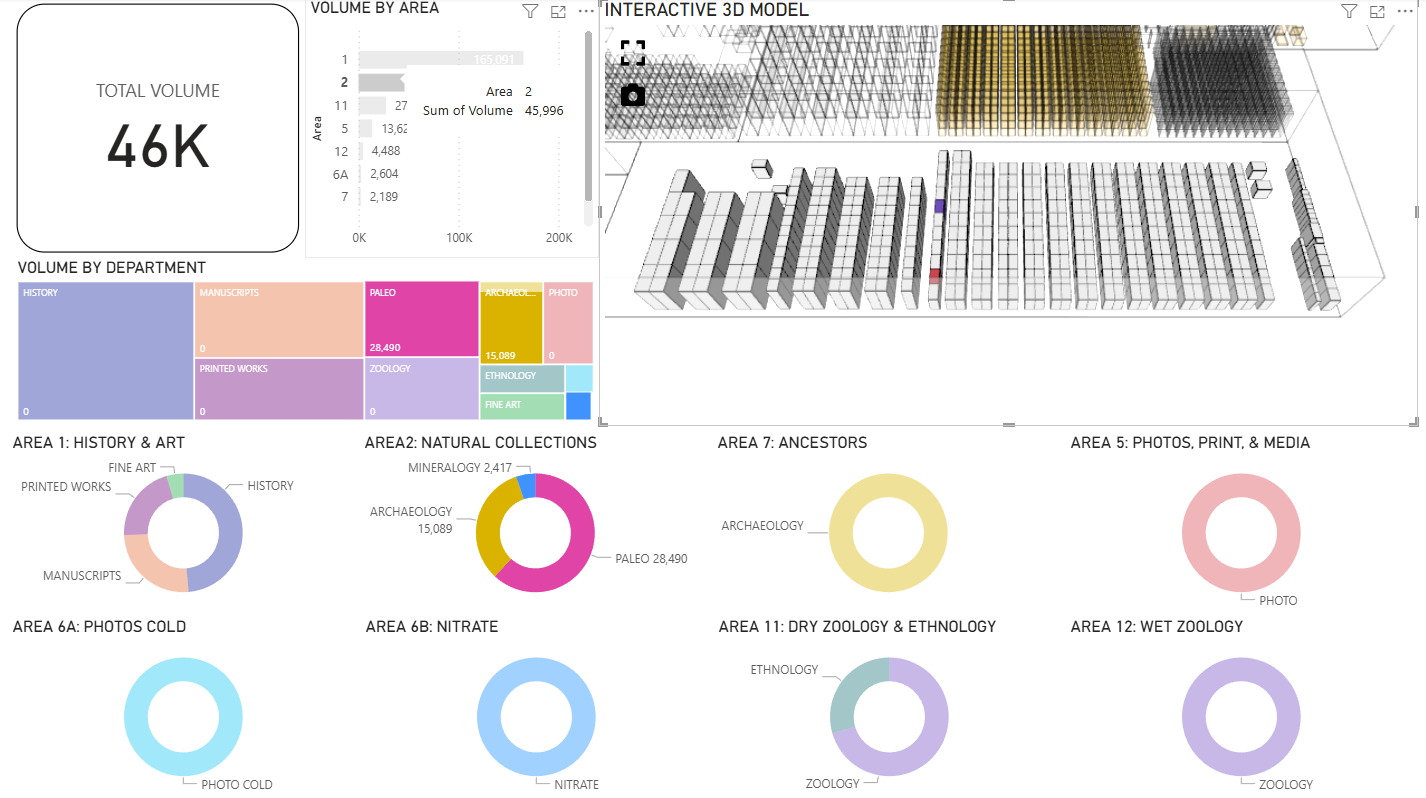
4 | Vendor Collaboration
Finally, the Revit file is shared with shelving vendors, enabling them to prioritize layouts and provide accurate cost estimates. In this way, our schematic workflow enables vendors to quickly assess and design proprietary shelving systems with accurate shelving sizes and best-practice recommendations.
Why Parametric Workflows Are Game-Changers
These workflows enable adaptable, data-rich 3D modeling that connects an ecosystem of software packages. For designers, this means faster iterations and fewer errors. For museum clients, it means confidence that their collections will be housed efficiently and safely.
SmithGroup is refining this workflow to make it a more powerful tool for collections assessments. We are exploring how to track individual objects to inform shelving needs with even greater precision. We are also working to develop standardized protocols for gathering collections data to streamline future assessments.
Why This Matters for Museums
Museums are stewards of culture and history, and their collections deserve facilities that reflect that responsibility. By embracing computational workflows, institutions can move beyond static spreadsheets and into a world of dynamic, data-driven design suited for our digital age, and the confidence in decision-making that comes from reliable, visualized, intuitive data. The result is not just efficiency—it is a smarter, more rigorous approach to preserving the treasures that define our shared heritage.